
Ethereum Price Targets $4,000 as ETF Inflows Hit $5.1 Billion

Last Updated on July 26, 2025 by Michael Motha
Ethereum Price Targets $4,000 as Spot ETFs See Billions in Inflows
Ethereum is trading just below a critical resistance level, with growing institutional demand driving momentum. Recent inflows into spot Ethereum ETFs signal strong investor confidence, while bullish technical indicators—particularly an inverse head-and-shoulders pattern forming on the weekly chart—point toward a potential breakout. If ETH can push past the key $4,100 resistance, it may pave the way for a rally toward $5,000.
As of Saturday, July 26, Ethereum was priced at $3,745—just beneath the $4,100 threshold and up 172% from its April lows.
Spot Ethereum ETFs Attract Billions
Ethereum ETFs are showing sustained strength, with data from SoSoValue indicating consistent demand. These funds have recorded net inflows for 11 consecutive weeks, a clear sign of institutional accumulation.
In the past week alone, spot Ethereum ETFs added over $1.85 billion in assets, pushing total monthly inflows to $5.1 billion. Altogether, they now manage more than $20.6 billion in assets.
BlackRock’s ETHA ETF remains the dominant player, pulling in over $440 million in a single day on Friday. With more than $10.69 billion in assets, it commands about 50% of the market. Close behind is Fidelity’s FBTC, which has added $2.3 billion in inflows, lifting its total to $2.55 billion.
Why Institutions Are Buying Ethereum
Much of Ethereum’s appeal lies in its dominance across several core areas of the crypto ecosystem:
- NFTs: Ethereum continues to lead in the non-fungible token market, with 30-day sales volume jumping 58% to $301 million.
- DeFi: Ethereum powers the majority of the decentralized finance space, with its total value locked (TVL) reaching $186 billion and market dominance climbing to 67%. Top protocols include Aave, Uniswap, Sky, and Maple Finance.
- Tokenized Assets: Ethereum also leads in real-world asset tokenization, surpassing $7 billion in total tokenized assets. zkSync, a major player in this space, holds over $7 billion alone.
Technical Outlook: Can ETH Break $4,100?
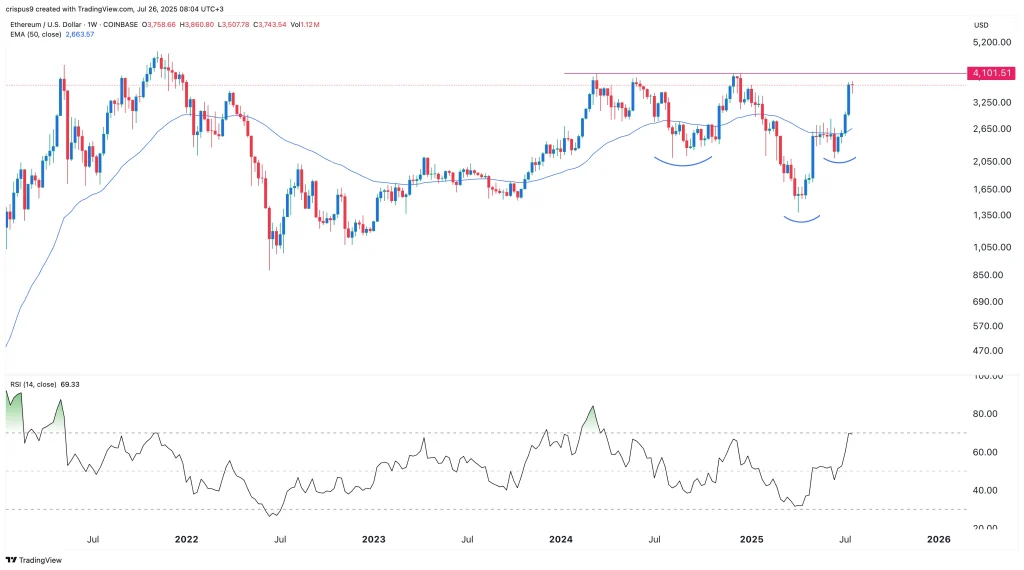
The weekly chart suggests that Ethereum is approaching a decisive level. The $4,100 mark aligns with both the neckline of an inverse head-and-shoulders pattern and the upper boundary of a potential triple-top formation—making it a pivotal resistance zone.
ETH remains comfortably above its 50-week Exponential Moving Average (EMA), and the Relative Strength Index (RSI) is nearing the overbought territory at 70.
If Ethereum breaks above $4,100, it would confirm the bullish reversal pattern and open the door to a move toward $5,000—marking the next major psychological and technical target.

Michael Motha is the Founder and Managing Director of CryptoNewsOnlineHub and works as a freelance Project Head. He is a dedicated Crypto enthusiast and researcher focusing on blockchain trends, digital assets, and emerging crypto technologies. With academic qualifications in Physics, MBA, and B.Ed from Loyola College, Chennai, he brings clarity to complex crypto topics through insightful content. Outside of crypto, he enjoys blogging, travel, music, and sports such as badminton and tennis.